By: Michael Hyman, A RESEARCH DATA SPECIALIST FOR THE NATIONAL ASSOCIATION OF REALTORS®.
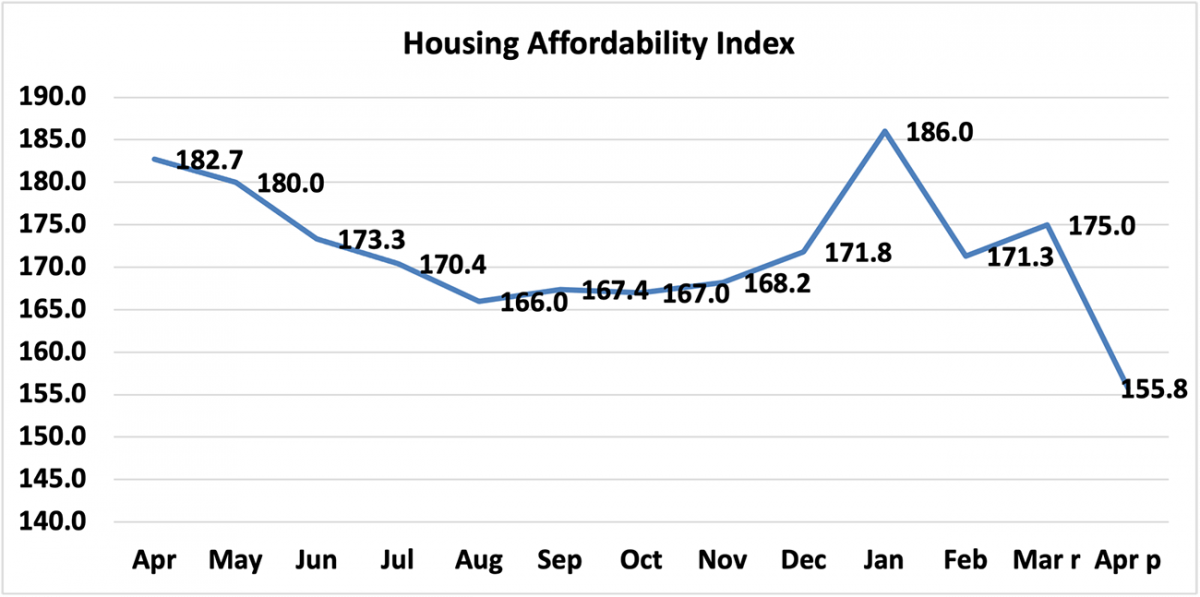
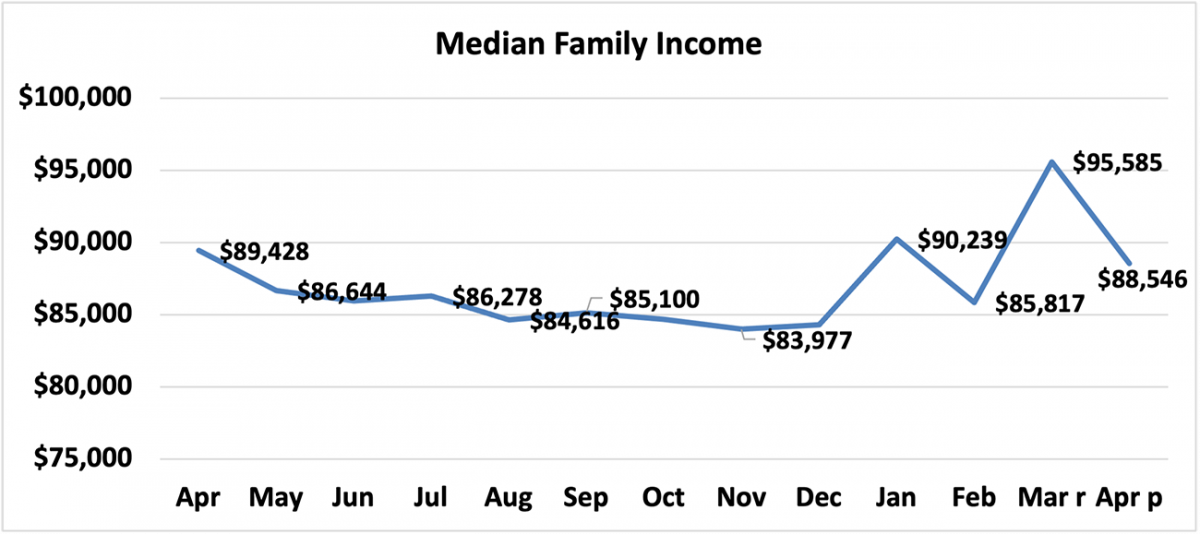
At the national level, housing affordability declined in April compared to a year ago, according to NAR’s Housing Affordability Index. Affordability declined in April compared to March as the median family incomes declined by 1.0% while the monthly mortgage payment increased 16.1%. The effective 30-year fixed mortgage rate1 was 3.11% this April compared to 3.37% one year ago, but the median existing-home sales price rose 19.9% from one year ago.
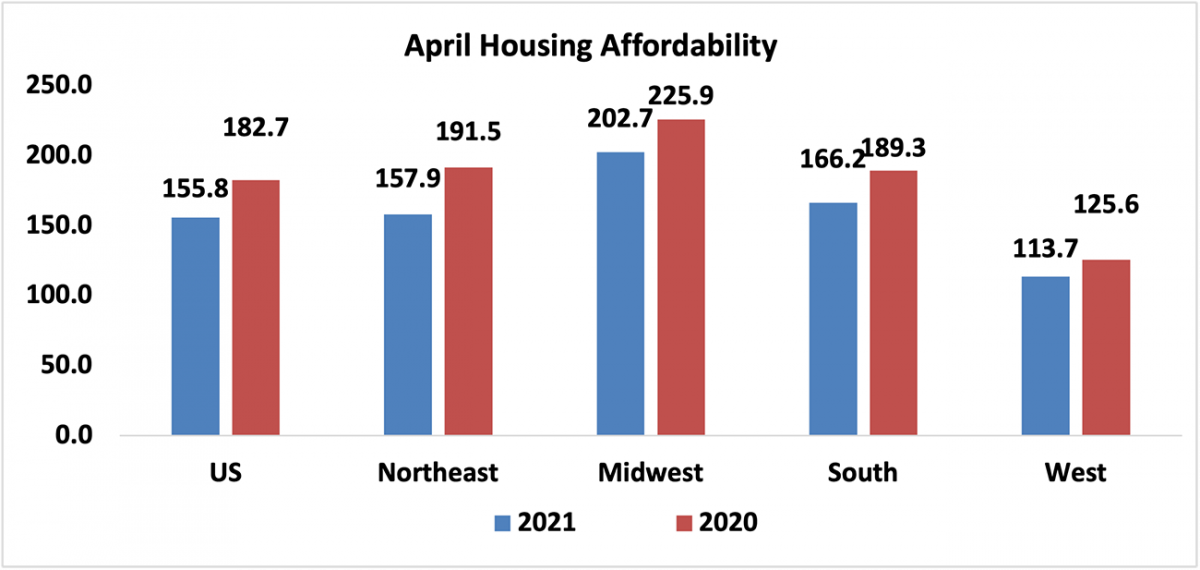
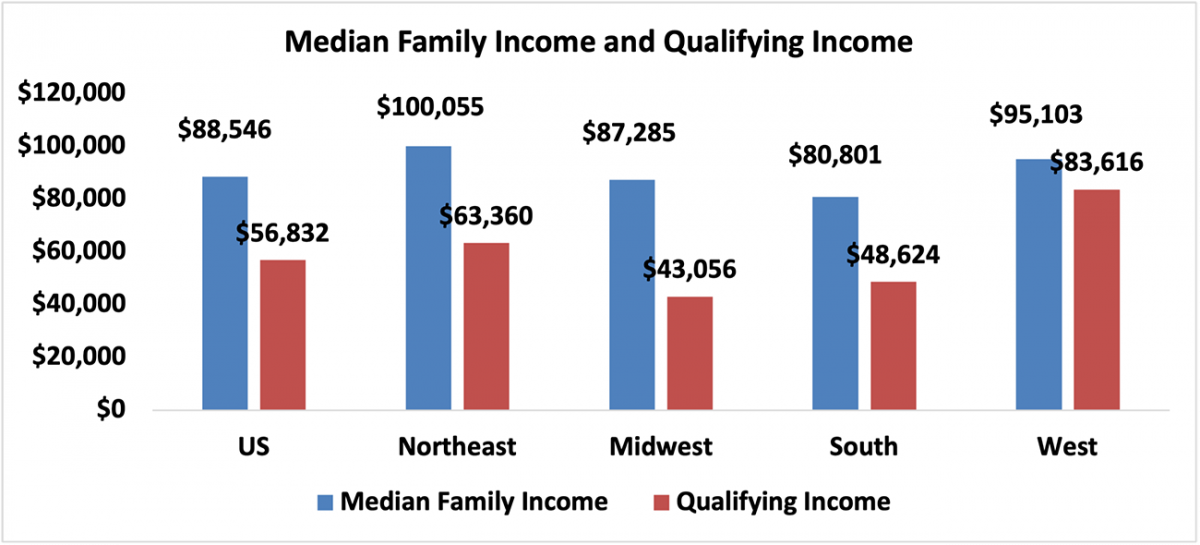
As of April 2021, the national and regional indices were all above 100, meaning that a family with the median income had more than the income required to afford a median-priced home. The income required to afford a mortgage, or the qualifying income, is the income needed so that mortgage payments make up 25% of family income.2 The most affordable region was the Midwest, with an index value of 202.7 (median family income of $87,285, which is more than twice the qualifying income of $43,056). The least affordable region remained the West, where the index was 113.7 (median family income of $95,103 and qualifying income of $83,616). The South was the second most affordable region with an index of 166.2 (median family income of $80,801 and qualifying income of $48,624) The Northeast was the second most unaffordable region with an index of 157.9 (median family income of $100,055 with a qualifying income of $63,360).
Housing affordability3 declined from a year ago in all of the four regions. The Northeast had the biggest decline of 17.5%. The South region experienced the strongest decline in price growth, compared to a year ago, of 12.2%. The Midwest region fell by 10.3% and was followed by the West, which decreased 9.5%.
Affordability is down in all four regions from last month. The Midwest had the biggest decline of 12.0%, followed by the Northeast, which fell 10.7%. The South region fell 9.8%, followed by the West region, with the smallest decrease of 8.2%.
Nationally, mortgage rates were down 26 basis points from one year ago (one percentage point equals 100 basis points).
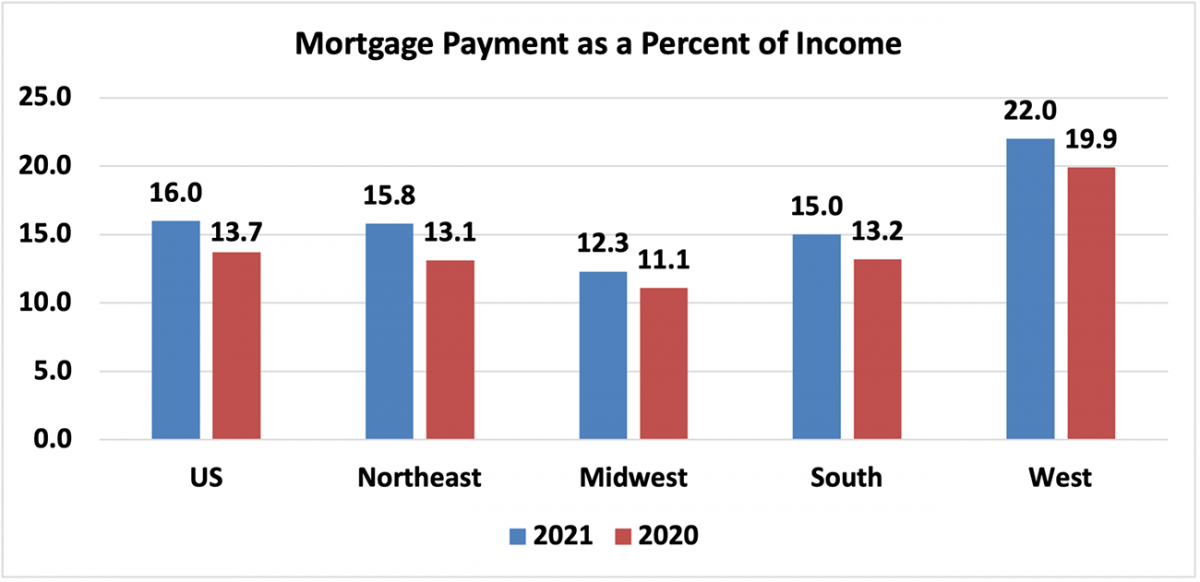
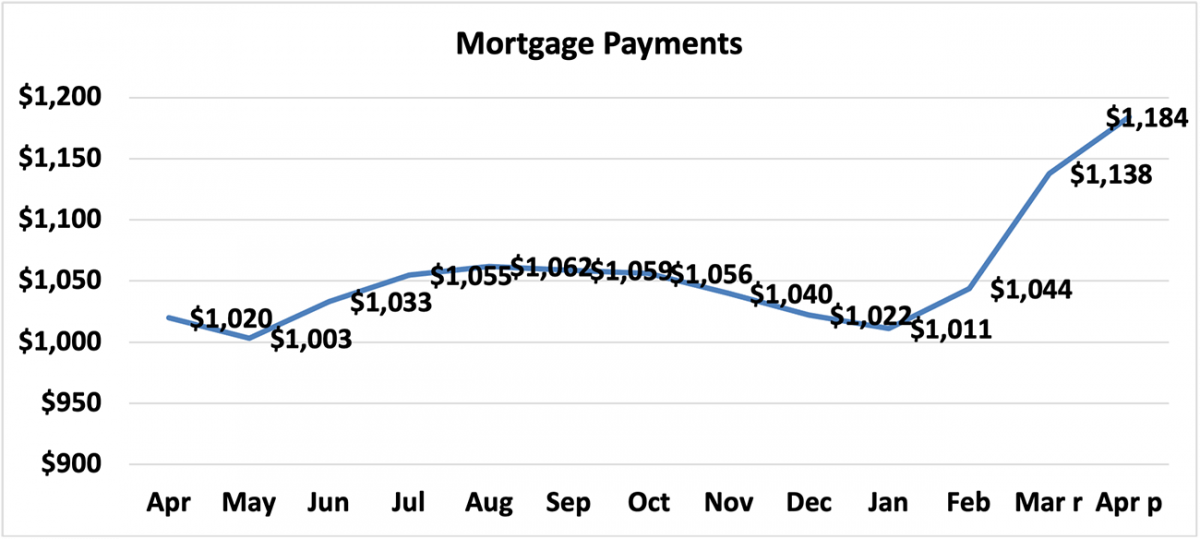
Compared to one year ago, the monthly mortgage payment rose to $1,184 from $1,020, an increase of 16.1%, The annual mortgage payment as a percentage of income inclined to 16.0% this April from 13.7% from a year ago due to higher home prices and a decline in median family incomes. Regionally, the West has the highest mortgage payment to income share at 22.0 % of income. Home prices in the West have reached an all-time high of $509,400. The Northeast had the second highest share at 15.8%, followed by the South with its share at 15.0%. The Midwest had the lowest mortgage payment as a percentage of income at 12.3%. Mortgage payments are not burdensome if they are no more than 25% of income.4
Lack of home supply is pushing home prices higher, which is having a huge impact on affordability and first-time home buyers. Incomes are coming down from recent highs, and declining incomes with higher home prices is not a good combination for a potential home buyer.
This week The Mortgage Bankers Association reported an increase in mortgage applications from a week ago. Mortgage credit availability was up 2.2% in April. New home purchase applications are down 5.9% compared to a year ago.
What does housing affordability look like in your market? View the full data release.
The Housing Affordability Index calculation assumes a 20% down payment and a 25% qualifying ratio (principal and interest payment to income). See further details on the methodology and assumptions(link is external) behind the calculation.
Housing Affordability Declines as Prices Continue to Rise and Incomes Fall (nar.realtor)

 Facebook
 X
X
 Pinterest
 Copy Link
