 Facebook
 Twitter
 Pinterest
 Copy Link
Analyzing the US Job Market
Jobs continue to return, but the pace has slowed significantly. The country added 638,000 jobs in October, which was surprisingly strong due to the current rate of COVID-19 cases.
It’s good to see the unemployment rate drop, but the amount of people who have been unemployed for more than six months has increased by 1.2 million.
")
")
While the number of temporary laid off workers is dropping, the amount of temporary laid off workers still still came in at 2.3 million. That is down from 18 million back in April and while it’s better it is still at an elevated number.
The number of permanent lay offs continue to rise, which leads economists to still believe that a full recovery in jobs is still a long ways away.
")
4 Reasons Why the Election Won’t Dampen the Housing Market


Tomorrow, Americans will decide our President for the next four years. That decision will have a major impact on many aspects of life in this country, but the residential real estate market will not be one of them.
Analysts will try to measure the impact feasible changes in regulations might have on housing, the effect of a possible first-time buyer program, and any number of other situations based on who wins. The housing market, however, will remain strong for four reasons:
1. Demand Is Strong among Millennials
The nation’s largest generation began entering the housing market last year as they reached the age to marry and have children – two key drivers of homeownership. As the Wall Street Journal recently reported:
“Millennials, long viewed as perennial home renters who were reluctant or unable to buy, are now emerging as a driving force in the U.S. housing market’s recent recovery.”
2. Mortgage Rates Are Historically Low
All-time low interest rates are also driving demand across all generations. Strong demand created by this rate drop has countered other economic disruptions (e.g., pandemic, recession, record unemployment).
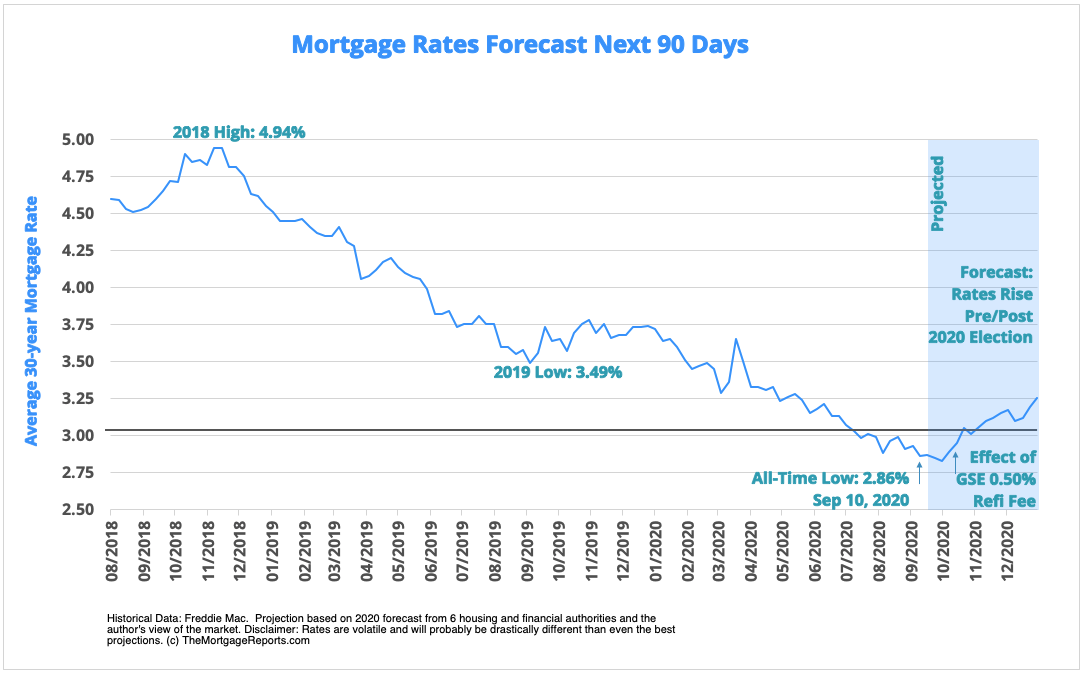
In addition, Freddie Mac just forecasted mortgage rates to remain low through next year:
“One of the main drivers of the strong housing recovery is historically low mortgage interest rates…Given weakness in the broader economy, the Federal Reserve’s signal that its policy rate will remain low until inflation picks up, and no signs of inflation, we forecast mortgage rates to remain flat over the next year. From the third quarter of 2020 through the end of 2021, we forecast mortgage rates to remain unchanged at 3%.”
3. Prices Continue to Appreciate
The continued lack of supply of existing homes for sale coupled with the surge in buyer demand has experts forecasting strong price appreciation over the next twelve months.
4. History Says So
Though it’s true that the market slows slightly in November when it’s a Presidential election year, the pace returns quickly. Here’s an explanation as to why from the Homebuilding Industry Report by BTIG:
“This may indicate that potential homebuyers may become more cautious in the face of national election uncertainty. This caution is temporary, and ultimately results in deferred sales, as the economy, jobs, interest rates and consumer confidence all have far more meaningful roles in the home purchase decision than a Presidential election result in the months that follow.”
Ali Wolf, Chief Economist for Meyers Research, also notes:
“History suggests that the slowdown is largely concentrated in the month of November. In fact, the year after a presidential election is the best of the four-year cycle. This suggests that demand for new housing is not lost because of election uncertainty, rather it gets pushed out to the following year as long as the economy stays on track.”
Bottom Line
There’s no doubt this is one of the most contentious presidential elections in our nation’s history. The outcome will have a major impact on many sectors of the economy. However, as Matthew Speakman, an economist at Zillow, explained last week:
“While the path of the overall economy is likely to be most directly dictated by coronavirus-related and political developments in the coming months, recent trends suggest that the housing market – which has basically withstood every pandemic-related challenge to this point – will continue its strong momentum in the months to come.”
The Latest Housing Data
At the end of Matthew Gardner’s video he states that the housing market continues to outperform, but the pace of price growth is not sustainable and while it has to start tapering off at some point it isn’t quite there yet. Check out the graphs below or watch his video to see what was going on with the real estate market in September 2020.
The theme of this video shows an incredibly hot market that has the potential to turn, because prices have skyrocketed and homes are becoming unaffordable. Another resource for you to look at is the housing affordability index. We get these numbers from the National Association of Realtors, and will continue to update them as they come in.
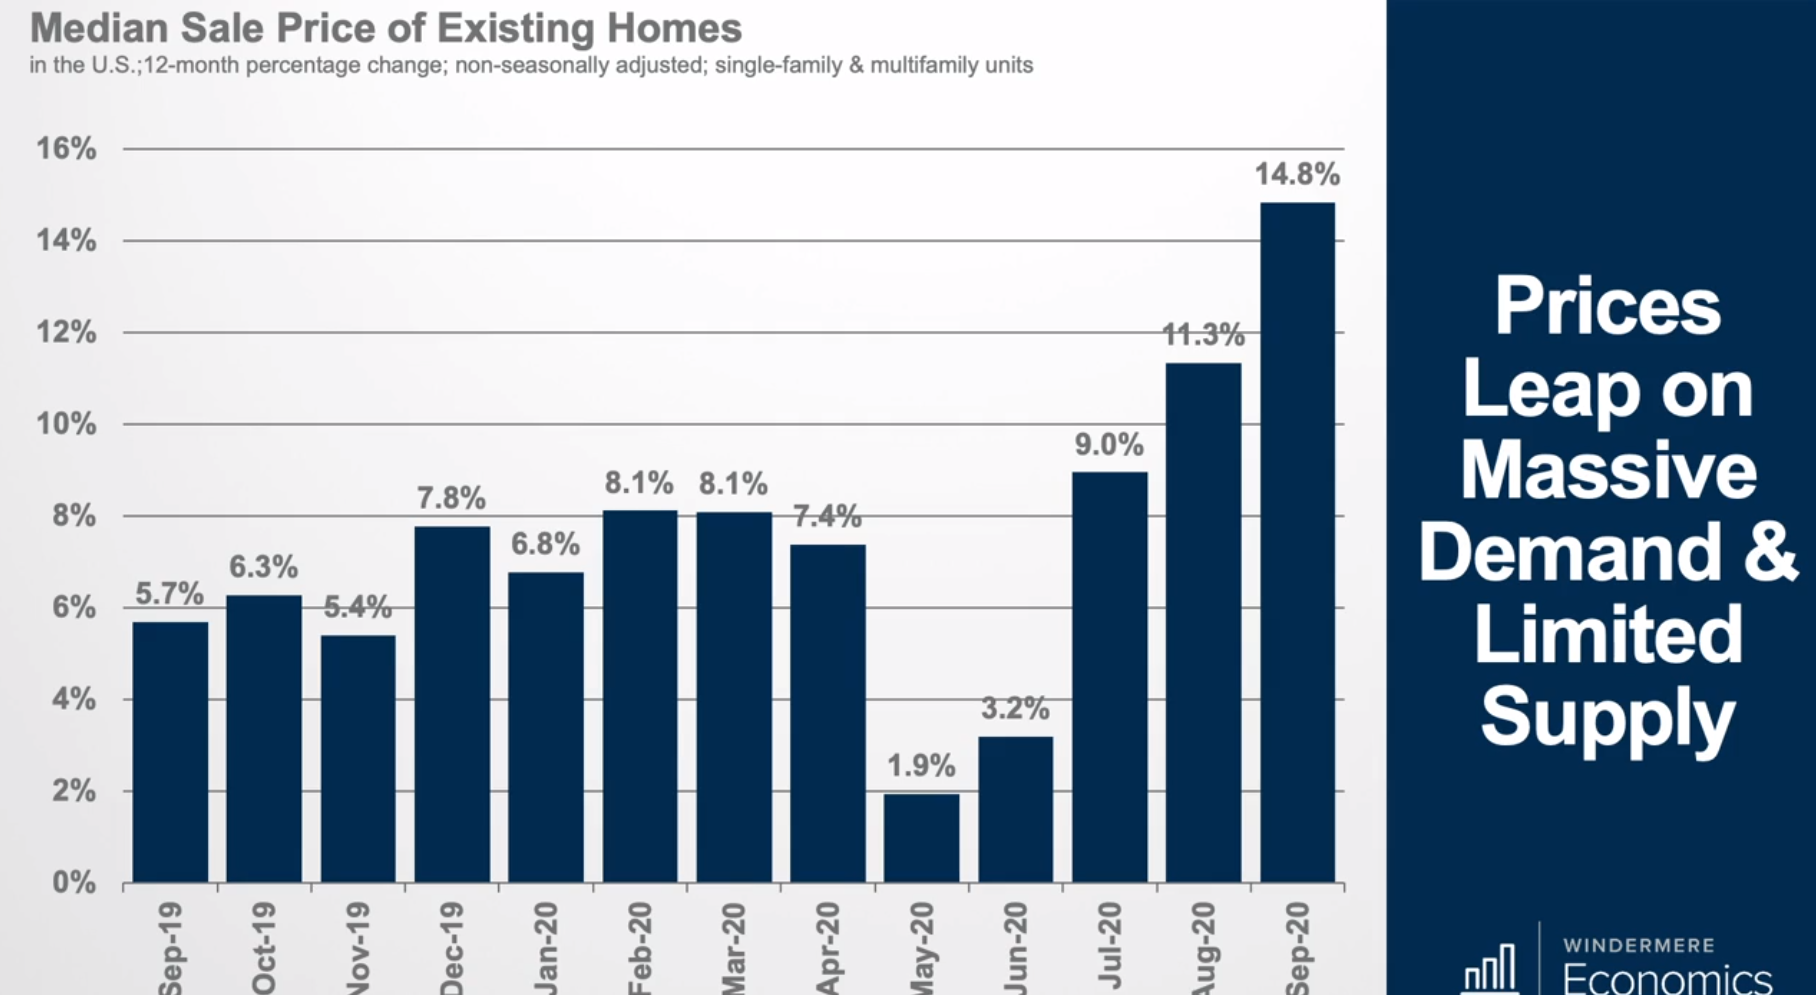
Matthew Gardner talks about the tight supply of housing and how it is affecting home prices. The median sale price in September was $311,800, which is up by 14.8% compared to a year ago. This is the fastest pace of growth since data started to be collected all the way back in 1968!!
Looking at single family homes annual sales came in at almost 5.9 million, which is up 21.8% and also up 9.7% compared to august of this year. Housing supply is limited with only 1.2 million homes for sale and the months of supply is 2.5 which is another record low. Prices are reflecting massive demand and limited supply with the median sale price being $316,200 which is up 15.2% compared to a year ago. We haven’t seen this pace of of price growth since 2005.
")
Single family building permits rose by 7.8% to annual rate of 1.12 million units a number we haven’t seen since 2007. The number of developments that have yet to break ground has risen to a value that we haven’t seen since 2018. Hopefully this means more supply down the road. Material, land, and labor, costs are all very high making it difficult for builders to bring homes to market that buyer’s can afford.

The Latest Housing Information
At the end of Matthew Gardner’s video he states that the housing market continues to outperform, but the pace of price growth is not sustainable and while it has to start tapering off at some point it isn’t quite there yet. Check out the graphs below or watch his video to see what was going on with the real estate market in September 2020.
The theme of the video below shows an incredibly hot market that has the potential to turn, because prices have skyrocketed and homes are becoming unaffordable. Another resource for you to look at is the housing affordability index. We get these numbers from the National Association of Realtors, and will continue to update them as they come in.
Matthew Gardner talks about the tight supply of housing and how it is affecting home prices. The median sale price in September was $311,800, which is up by 14.8% compared to a year ago. This is the fastest pace of growth since data started to be collected all the way back in 1968!!
Looking at single family homes annual sales came in at almost 5.9 million, which is up 21.8% and also up 9.7% compared to august of this year. Housing supply is limited with only 1.2 million homes for sale and the months of supply is 2.5 which is another record low. Prices are reflecting massive demand and limited supply with the median sale price being $316,200 which is up 15.2% compared to a year ago. We haven’t seen this pace of of price growth since 2005.
Single family building permits rose by 7.8% to annual rate of 1.12 million units a number we haven’t seen since 2007. The number of developments that have yet to break ground has risen to a value that we haven’t seen since 2018. Hopefully this means more supply down the road. Material, land, and labor, costs are all very high making it difficult for builders to bring homes to market that buyer’s can afford.
Mortgage Rates and Housing Affordability
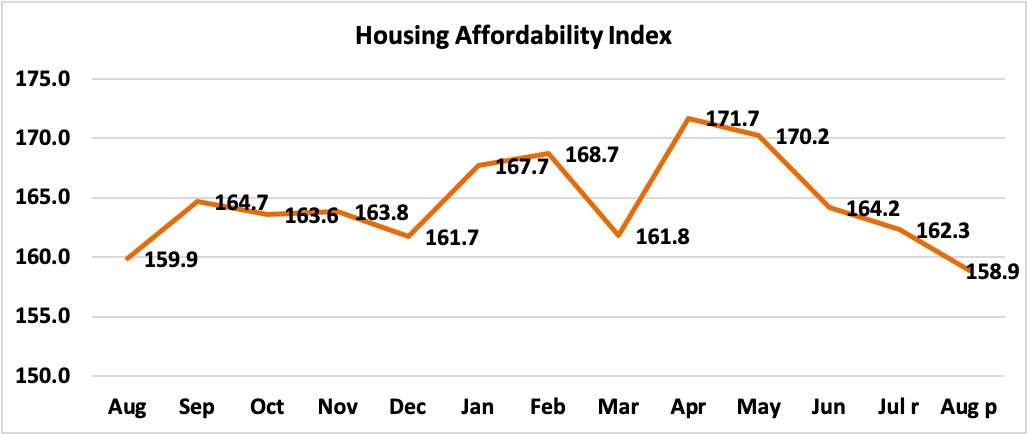
What the below means in layman’s terms, is the low interest rates have fueled the housing market. This is causing home values to go up faster than mortgage rates are dropping. As a result we could find many buyers getting priced out of the market. When buyers exit a sellers market, supply and demand is affected. Sometimes this is where you will see a shift in the market. The higher the number in the housing affordability index indicates more affordability. The index is now on the decline and when it reaches 100 is when the median income qualifies for the median priced home.
Looking back to 2006 the affordability rate was 108 representing it was the most expensive time to buy a home since 1990. In 2008, the market had shifted significantly downwards and the index increased to 138 indicating the most affordable time to buy a house ever.
Shifting into April 2020, the index was at 171.7 reaching a new high in affordability. In October 2020, the National Association of Realtors published the chart below where we see a decline in the index down to 158.9 in August.
If the index continues to drop we will likely see a shift in the market from a sellers market to a buyer’s market, if the index approaches 100.
Remember when it goes below 100 the average family cannot afford the average home.
If you would like to discuss how this might affect you please feel free to contact me at (253) 732 – 2500.
Interest Rates and Housing Affordability
What this means in layman’s terms, is the low interest rates have fueled the housing market. This is causing home values to go up faster than interest rates are dropping. As a result we could find many buyers getting priced out of the market. When buyers exit a sellers market, supply and demand is affected. Sometimes this is where you will see a shift in the market. The higher the number in the housing affordability index indicates more affordability. The index is now on the decline. When it reaches 100 is when the median income qualifies for the median priced home.
Looking back to 2006 the affordability rate was 108. This represents the most expensive time to buy a home since 1990. In 2008, the market had shifted significantly downwards and the index increased to 138. This indicated the most affordable time to buy a house ever.
Shifting into April 2020, the index was at 171.7 reaching a new high in affordability. In October 2020, the National Association of Realtors published the chart below where we see a decline in the index down to 158.9 in August.
If the index continues to drop we will likely see a shift in the market from a sellers market to a buyer’s market, if the index approaches 100.
Remember when it goes below 100 the average family cannot afford the average home.
If you would like to discuss how this might affect you please feel free to contact me at (253) 732 – 2500.
Click here to view our real time market statistics in Gig Harbor!
Housing Affordability Weakens in August 2020 as Home Prices Rose Faster than Median Family Incomes
At the national level, housing affordability declined in August 2020 compared to a year ago and fell compared to July, according to NAR’s Housing Affordability Index. Affordability dipped in August compared to August as the median family income rose by 2.2% while the median home prices rose by 11.7%. The effective 30-year fixed mortgage rate1 fell to 3.00% this August from 3.08% in July. Mortgage rates are at all-time lows compared to a year ago at 3.66%.

As of August 2020, the national and regional indices were all above 100, meaning that a family with the median income had more than the income required to afford a median-priced home. The income required to afford a mortgage, or the qualifying income, is the income needed so that mortgage payments make up no more than 25% of family income. The most affordable region was the Midwest, with an index value of 197.3 (median family income of $79,570 which is almost more than twice the qualifying income of $40,320). The least affordable region remained the West, where the index was 115.5(median family income of $86,744 and the qualifying income of $75,072). For comparison, the index was 167.1 in the South (median family income of $74,666 and the qualifying income of $44,688) and 161.7 in the Northeast (median family income of $92,605 with a qualifying income of $57,264).

While homes are typically affordable, housing affordability2 declined from a year ago in all regions, except in the Midwest where there was no change. The Northeast HAI had a modest decline of 0.1% followed by the South HAI with a dip of 0.8%. The West HAI had the biggest drop of 1.0%.
Affordability is down in all of the four regions from last month. The South HAI had a decline of 1.2% followed by the West HAI with a dip of 1.3%. The Midwest HAI had a decline of 1.7% followed by the Northeast HAI with the biggest drop of 5.8%.
Nationally, mortgage rates were down 66 basis points from one year ago (one percentage point equals 100 basis points). The median sales price for a single-family home sold in August in the US was $315,000 up 11.7% from a year ago, while median family incomes rose 2.2 % in 2020 from one year ago.

Even with lower mortgage rates compared to one year ago, the payment as a percentage of income rose modestly to 15.7% this August from 15.6% from a year ago. Regionally, the West has the highest mortgage payment to income share at 21.6% of income. The Northeast had the second highest share at 15.5% followed by the South with their share at 15.0%. The Midwest had the lowest mortgage payment as a percentage of income at 12.7%. Mortgage payments are not burdensome if they are no more than 25% of income.3

This week the Mortgage Bankers Association reported that for the week ending October 2, mortgage applications increased 4.6 from the week prior. Inventory levels are extremely low so more housing supply is needed to help tame price growth. New home sales are on the rise. Consumers can still take advantage of borrowing while rates are historically low.
What does housing affordability look like in your market? View the full data release.
The Housing Affordability Index calculation assumes a 20% down payment and a 25% qualifying ratio (principal and interest payment to income). See further details on the methodology and assumptions behind the calculation.
1 Starting in May 2019, FHFA discontinued the release of several mortgage rates and only published an adjustable-rate mortgage called PMMS+ based on Freddie Mac Primary Mortgage Market Survey. With these changes, NAR discontinued the release of the HAI Composite Index (based on 30-year fixed-rate and ARM) and starting in May 2019 only releases the HAI based on a 30-year mortgage. NAR calculates the 30-year effective fixed rate based on Freddie Mac’s 30-year fixed mortgage contract rate, 30-year fixed mortgage points and fees, and a median loan value based on the NAR median price and a 20% down payment.
2 A Home Affordability Index (HAI) value of 100 means that a family with the median income has exactly enough income to qualify for a mortgage on a median-priced home. An index of 120 signifies that a family earning the median income has 20 percent more than the level of income needed pay the mortgage on a median-priced home, assuming a 20% down payment so that the monthly payment and interest will not exceed 25% of this level of income (qualifying income).
3 Total housing costs that include mortgage payment, property taxes, maintenance, insurance, utilities are not considered burdensome if they account for no more than 30% of income.
Three of the Latest Reports Show Housing Market Is Strong


The residential real estate market is remaining resilient as the country still struggles to beat the COVID-19 pandemic. Three separate reports recently revealed how the housing market is still showing growth. Here’s a look at each one.
1. Ivy Zelman’s Real Estate Broker Survey
The survey explains that purchaser demand remains strong:
“This month’s overall homebuyer demand rating…was easily the strongest sequential gain in our survey history…Strength continues to be led by the entry-level…While high-end demand is less robust in an absolute sense, there has also been relative improvement, with contacts attributing incremental improvement to the stock market’s rebound, record low mortgage rates and luxury customers trading out of high-priced cities.”
2. The National Association of Home Builders Housing Market Index
The index reveals that builder confidence has returned to levels last seen prior to the pandemic:
“In a strong signal that the housing market is ready to lead a post-COVID economic recovery, builder confidence in the market for newly-built single-family homes jumped 14 points to 72 in July, according to the latest National Association of Home Builders/Wells Fargo Housing Market Index (HMI). The HMI now stands at the solid pre-pandemic reading in March before the outbreak affected much of the nation.”
3. The realtor.com Housing Market Recovery Index
This index leverages a weighted average of four key components of the housing industry, tracking each of the following:
- Housing Demand – Growth in online search activity
- Home Price – Growth in asking prices
- Housing Supply – Growth of new listings
- Pace of Sales – Difference in time-on-market
It then compares the current status “to the last week of January 2020 market trend, as a baseline for pre-COVID market growth. The overall index is set to 100 in this baseline period. The higher a market’s index value, the higher its recovery and vice versa.”
The latest results came in at 101, with realtor.com explaining:
“The U.S. Housing Market has recovered from the immediate disruption caused by the COVID pandemic and returned to January 2020 growth levels.”
Bottom Line
Real estate brokers, home builders, and industry data all agree that the housing market has surged back to pre-COVID levels, showing growth, strength, and incredible resilience.
New Index Reveals Impact of COVID-19 on Real Estate


Earlier this month, realtor.com announced the release of their initial Housing Recovery Index, a weekly guide showing how the pandemic has impacted the residential real estate market. The index leverages a weighted average of four key components of the housing industry, tracking each of the following:
- Housing Demand – Growth in online search activity
- Home Price – Growth in asking prices
- Housing Supply – Growth of new listings
- Pace of Sales – Difference in time-on-market
The index then compares the current status “to the last week of January 2020 market trend, as a baseline for pre-COVID market growth. The overall index is set to 100 in this baseline period. The higher a market’s index value, the higher its recovery and vice versa.”
The graph below charts the index by showing how the real estate market started out strong in early 2020, and then dropped dramatically at the beginning of March when the pandemic paused the economy. It also shows the strength of the recovery since the beginning of May. It’s clear to see that the housing market is showing promising signs of recovery from the deep economic cuts we experienced earlier this spring. As noted by Dean Mon, Chairman of the National Association of Home Builders (NAHB):
“As the nation reopens, housing is well-positioned to lead the economy forward.”
The data today indicates the housing market is already on the way up.
Bottom Line
Staying connected to the housing market’s performance over the coming months will be essential, as we continue to evaluate exactly how the housing market is doing in this uncharted time ahead.
Best Time to Sell in Gig Harbor? When Competition Is at an All-Time Low


In a recent survey of home sellers by Qualtrics, 87% of respondents said they were concerned their home won’t sell because of the pandemic and resulting economic recession. Of the respondents, 51% said they are “seriously worried.” That concern seems reasonable considering the current condition of the economy. The data, however, is showing that home purchasers are still very active despite the disruptions American families have experienced this year.
The latest Existing Home Sales Report published by the National Association of Realtors (NAR) revealed that 340,000 single-family homes sold in this country last month. NAR’s most recent Pending Sales Report (homes going into contract) surpassed last month’s number by over 44%, which far exceeded analysts’ projections of 15%. ShowingTime reported that appointments to see homes (both virtually and in-person) have increased in every region of the country and are up 21.4% nationwide over the same time last year.
While buyer activity is surging, the number of listings has fallen to an all-time low. Zelman Associates, in their latest residential real estate report, revealed that housing inventory as a percentage of households has fallen to 1.2%, which is half of the long-term average and lower than any other time in our history.
Bidding Wars Heating Up Again
With buyer demand growing and the supply of available homes shrinking, purchasers are again finding themselves needing to outbid other buyers. NAR, in a recent blog post, revealed:
“On average, there were about three offers on a home that closed in May, up from just about two in April 2020 and in May 2019 (2.3 offers).”
Bidding wars guarantee houses sell quickly at a price near or even slightly over the listing price.
Bottom Line
If you’re thinking of selling, don’t be concerned about putting your house on the market right now. There’s no better time to sell an item than when demand for it is high and supply is low. It is exactly at that time when you will negotiate your best possible deal.


