 Facebook
 Twitter
 Pinterest
 Copy Link
Housing and Economic Update
Gardner jumps right into the data releases that came out in August and starts with the new housing permits and starts. New home permits (single family permits) fell by 17% in July and they have been heading backwards since March. Although we have seen a pull back over the past few months the trend is actually heading higher since we emerged from the financial crisis back in 2011.
The slow down in permits has impacted housing starts, which dropped by 4.5%. Starts fell across most regions with the exception of the West which increased by .9%. Gardner’s perspective is that the longer term is still improving, but not to the degree needed to address the massive housing shortage that the country faces. The number of homes actually being built rose by 1.5% in July, which is 33% higher in the same time a year ago.
The pullback in housing starts is not a surprise given the permit activity, but despite this, the overall pace of new home building actually remains relatively healthy with a six month moving average of homes under construction coming in above the pre-pandemic trend. Although there is a rise in material costs and affordability challenges, the fundamentals for home building remain solid.
Additionally, a recent ease in mortgage rates and a significant pull back in lumber prices (which have fallen sharply and are back to pre-pandemic prices) also provides support for growing new construction activity.
Moving on to new home sales in July, the number of homes for sale continue its upward trend and have risen by 5.5% versus June and is up over 26% compared to last year. The jump in listings was driven by a record rise in homes for sale that have yet to be built, which counted for over 29% in total inventory.
According to Freddie Mac, the US housing market is 3.8 million single family homes short of what’s needed to meet the countries demand. To catch up builders would have to construct between 1.1 and 1.2 million single family homes each year to meet long-term demand.
With more demand than new supply, Buyer’s turn their attention towards the existing home market. For the fifth month in a row inventory levels ticked higher and the number of new listings are up year over year.
Since new listing activity is still pretty robust, it has allowed sales to tick back up. On a month over month basis, home sales have risen by 1%. Home prices took a little bit of a breather in July and dropped by .8% month over month but they are still 17.8% higher than seen a year ago.
Overall, we are still quite far away from experiencing a normal housing market..
Update on Homes in Forbearance
This was a great month to look at the data for the number of homes in forbearance as the program stopped taking new applications at the end of June. The situation today is a vast improvement from where we were last may. More than 4.76 homes were in the program last May, but by mid-July this year the number dropped to just 1.86 million homes. This is an impressive recovery, as 2.9 million homeowners left the program between May 2020 and mid-July of 2021.
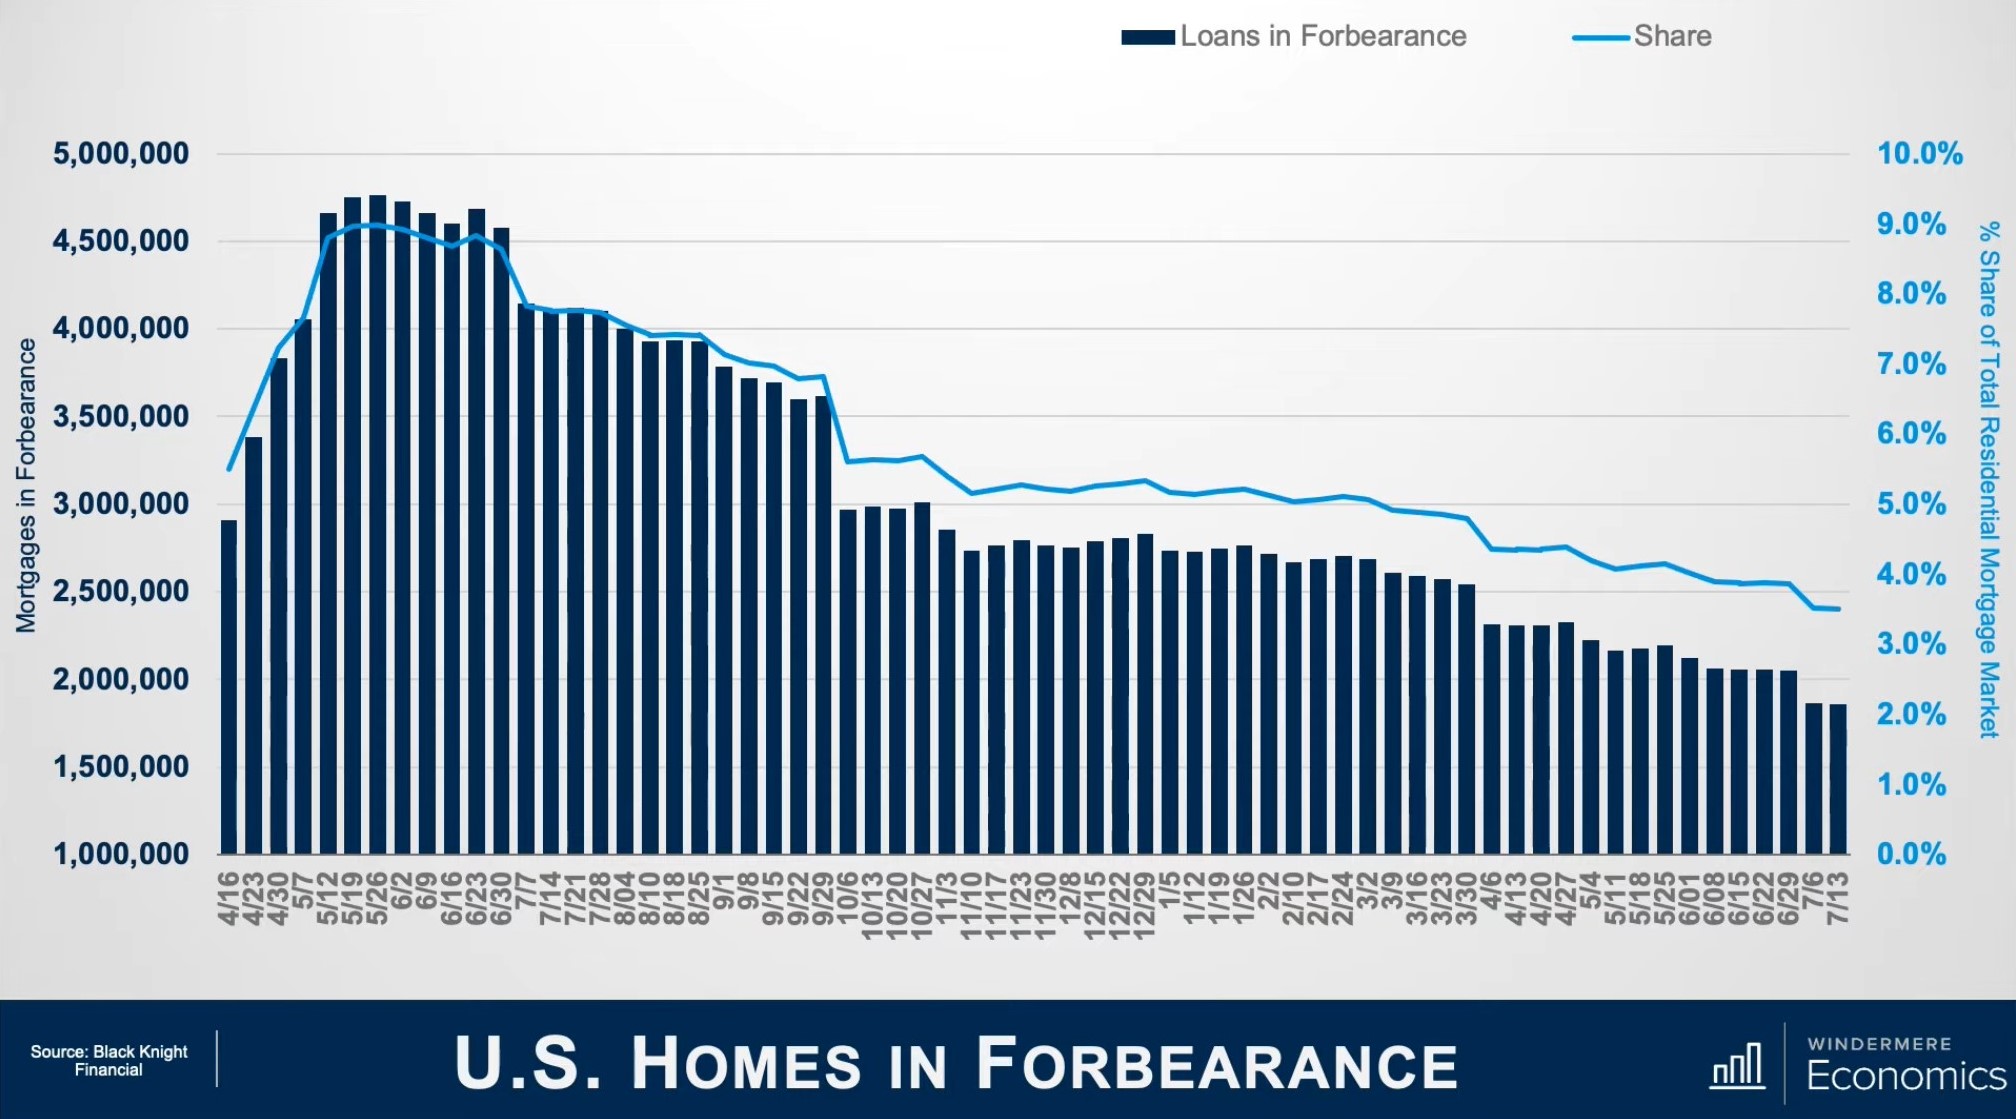
The number of active forbearance plans continue to fall, but the pace of the drop has certainly slowed over the last quarter or so.
Looking forward, almost 600,000 homes currently in forbearance are up for review, so the potential for a greater rate of improvement of the number of homes in the program is possible but not guaranteed.
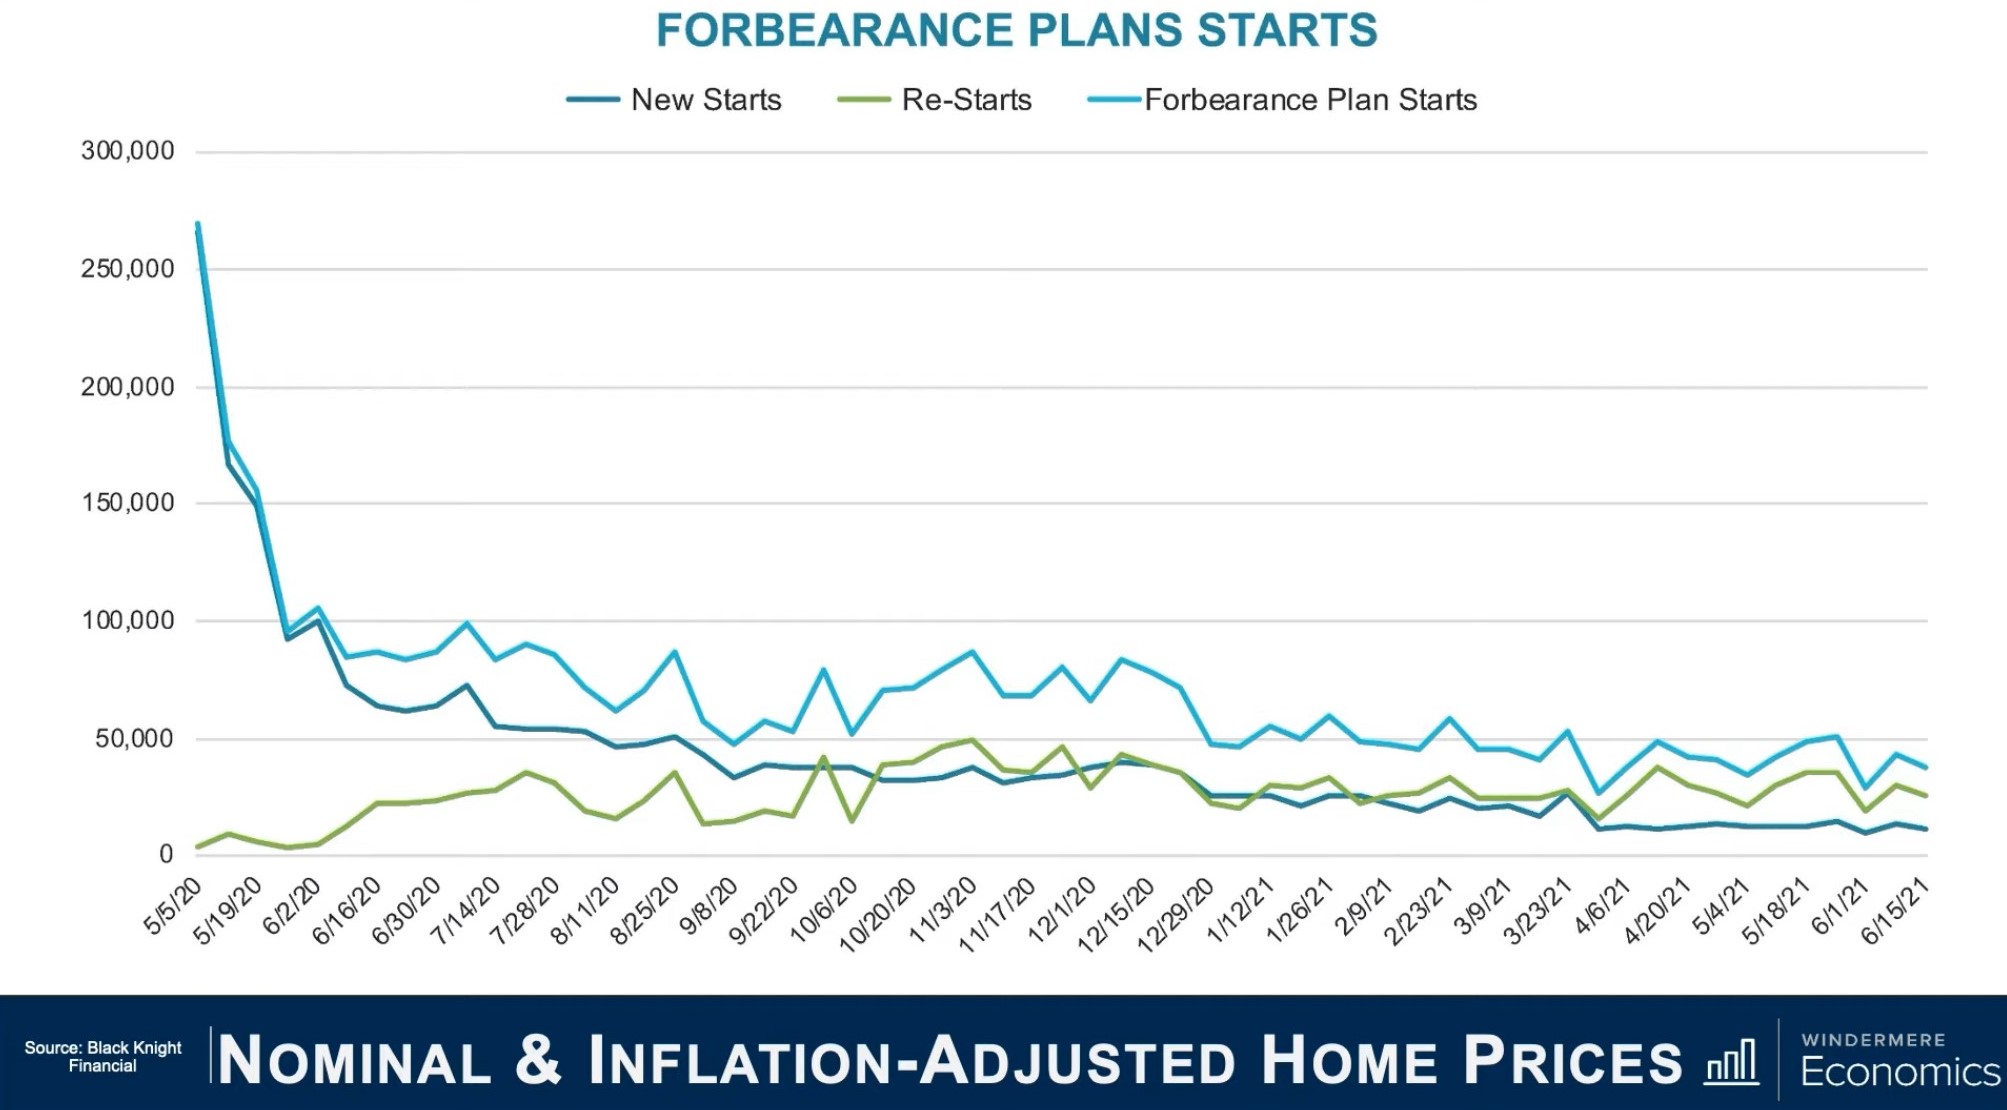
Starts are down by 3%, and new and repeat starts are 3-4% lower month over month. Of the roughly 460,000 homes in forbearance that were reviewed for extension or removal we saw 33% leave the program and 67% extend it. This is a low removal rate and we only expect people to come out of the program if the country continues to open up.
Roughly 7.25 million borrowers have used forbearance at one time or another throughout the course of the pandemic which represents 14% of homeowners in the country. Of that 7.25 million, 72% have left the plan and 28% remain in active forbearance. Loan performance remains pretty robust among homeowners who have left the program with 46% of borrowers getting things wrapped up with their lender on missed payments and 18% of homeowners paying off their loan in full.
Although the number of homes leaving the program has slowed, we still expect further improvement as we move through the year because we won’t be seeing any new homeowners entering the program.
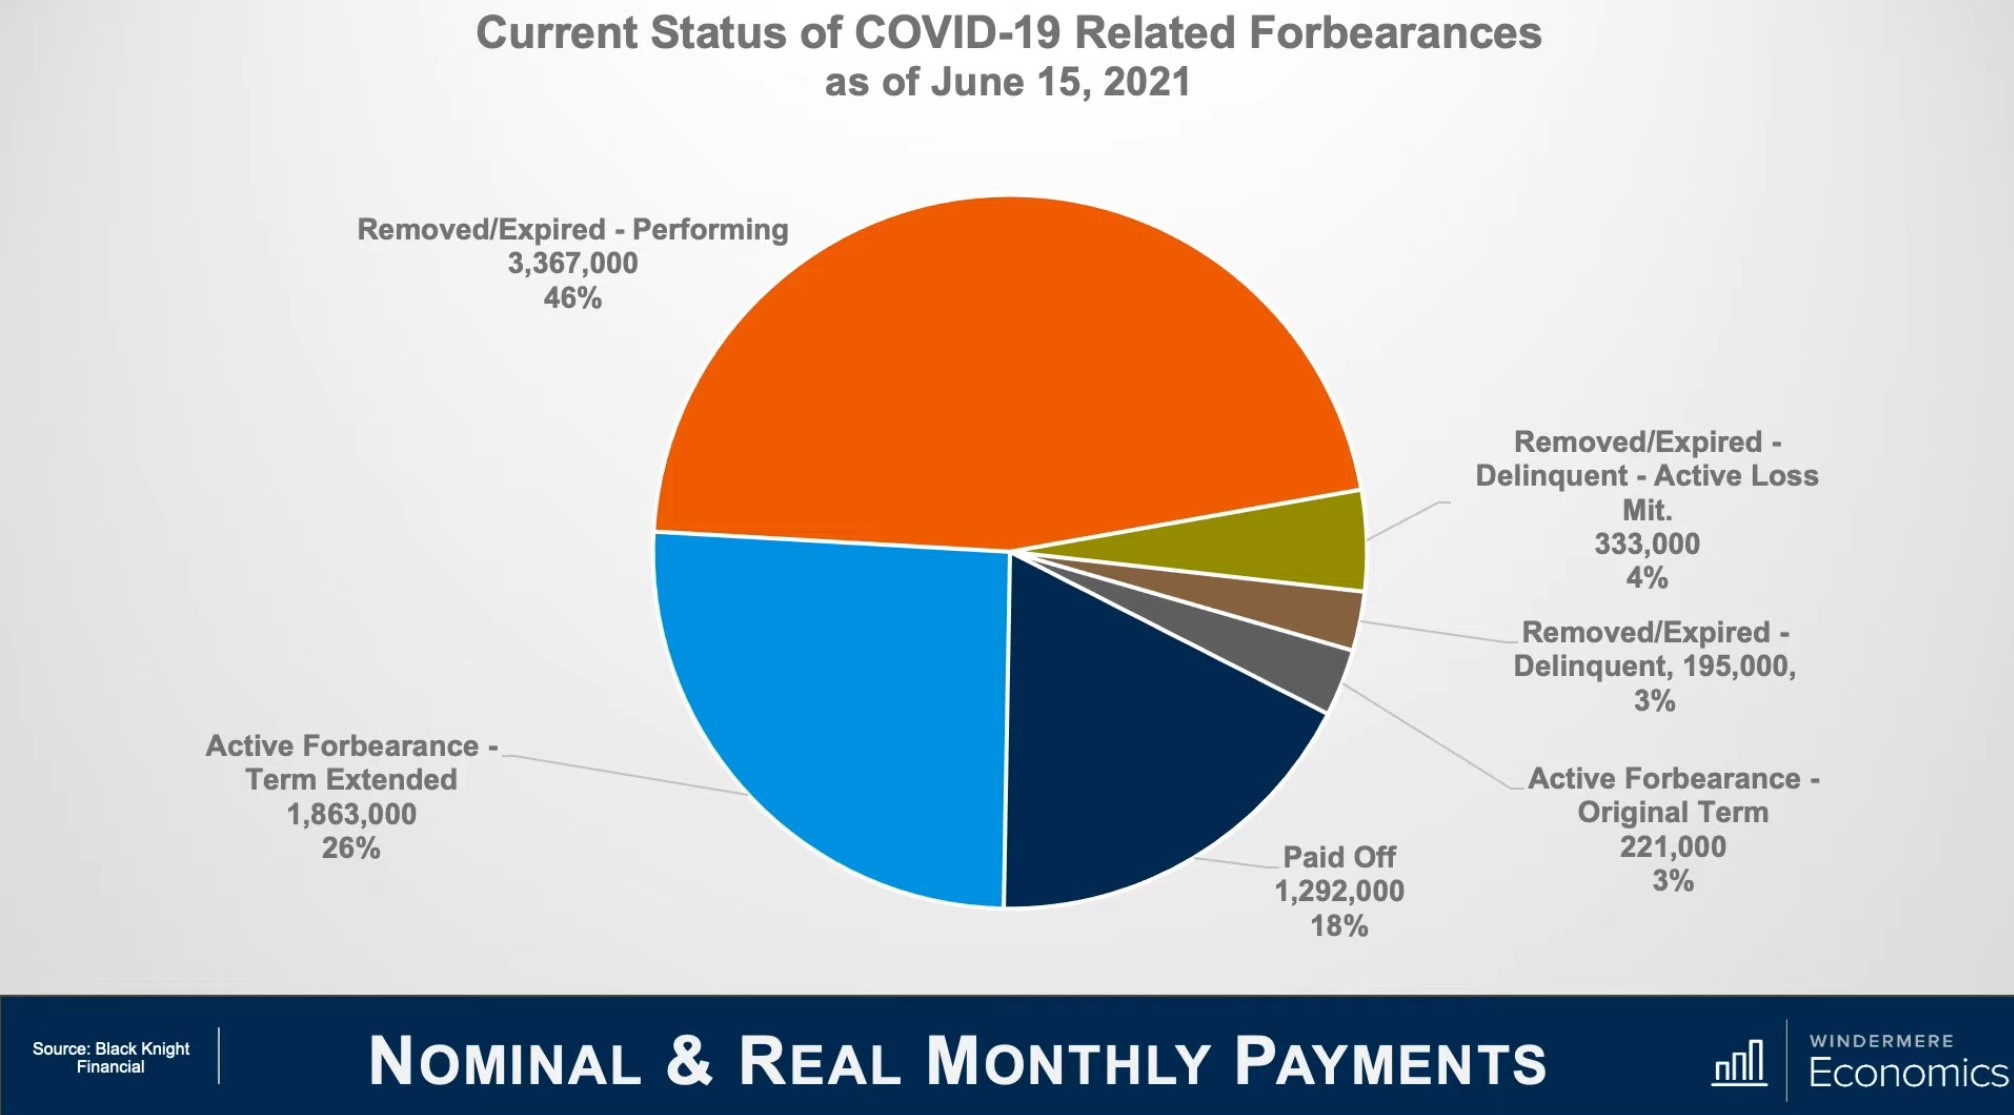
There are a couple of conclusions that can be drawn from this data. The first is that anyone believing there will be a flood of homes foreclosed on by the end of this year or 2022 is likely to will be disappointed. Even if every home in the program entered foreclosure the number of homes that would be foreclosed on would be minimal compared to the fall out following the financial crisis of more than a decade ago. Also, the build up of equity that all homeowners have seen if they bought before 2012 or even more recently suggest that if for whatever circumstance that homeowners in forbearance can’t get their head above water they will sell their home in order to keep the equity that they have accumulated. The bottom line is that the forbearance program was needed, and it has been successful so far at warding off home foreclosures due to the impact of the pandemic, but we will not see a huge wave of foreclosures in our near future.
Housing Affordability Declines as Prices Continue to Rise and Incomes Fall
By: Michael Hyman, A RESEARCH DATA SPECIALIST FOR THE NATIONAL ASSOCIATION OF REALTORS®.
At the national level, housing affordability declined in April compared to a year ago, according to NAR’s Housing Affordability Index. Affordability declined in April compared to March as the median family incomes declined by 1.0% while the monthly mortgage payment increased 16.1%. The effective 30-year fixed mortgage rate1 was 3.11% this April compared to 3.37% one year ago, but the median existing-home sales price rose 19.9% from one year ago.


As of April 2021, the national and regional indices were all above 100, meaning that a family with the median income had more than the income required to afford a median-priced home. The income required to afford a mortgage, or the qualifying income, is the income needed so that mortgage payments make up 25% of family income.2 The most affordable region was the Midwest, with an index value of 202.7 (median family income of $87,285, which is more than twice the qualifying income of $43,056). The least affordable region remained the West, where the index was 113.7 (median family income of $95,103 and qualifying income of $83,616). The South was the second most affordable region with an index of 166.2 (median family income of $80,801 and qualifying income of $48,624) The Northeast was the second most unaffordable region with an index of 157.9 (median family income of $100,055 with a qualifying income of $63,360).


Housing affordability3 declined from a year ago in all of the four regions. The Northeast had the biggest decline of 17.5%. The South region experienced the strongest decline in price growth, compared to a year ago, of 12.2%. The Midwest region fell by 10.3% and was followed by the West, which decreased 9.5%.
Affordability is down in all four regions from last month. The Midwest had the biggest decline of 12.0%, followed by the Northeast, which fell 10.7%. The South region fell 9.8%, followed by the West region, with the smallest decrease of 8.2%.
Nationally, mortgage rates were down 26 basis points from one year ago (one percentage point equals 100 basis points).
Compared to one year ago, the monthly mortgage payment rose to $1,184 from $1,020, an increase of 16.1%, The annual mortgage payment as a percentage of income inclined to 16.0% this April from 13.7% from a year ago due to higher home prices and a decline in median family incomes. Regionally, the West has the highest mortgage payment to income share at 22.0 % of income. Home prices in the West have reached an all-time high of $509,400. The Northeast had the second highest share at 15.8%, followed by the South with its share at 15.0%. The Midwest had the lowest mortgage payment as a percentage of income at 12.3%. Mortgage payments are not burdensome if they are no more than 25% of income.4


Lack of home supply is pushing home prices higher, which is having a huge impact on affordability and first-time home buyers. Incomes are coming down from recent highs, and declining incomes with higher home prices is not a good combination for a potential home buyer.
This week The Mortgage Bankers Association reported an increase in mortgage applications from a week ago. Mortgage credit availability was up 2.2% in April. New home purchase applications are down 5.9% compared to a year ago.
What does housing affordability look like in your market? View the full data release.
The Housing Affordability Index calculation assumes a 20% down payment and a 25% qualifying ratio (principal and interest payment to income). See further details on the methodology and assumptions(link is external) behind the calculation.
Housing Affordability Declines as Prices Continue to Rise and Incomes Fall (nar.realtor)
Is a Housing Bubble on the Horizon?
Today’s Monday’s with Matthew looks a bit different. While this 30 minute video is longer than the others, it is full of great information regarding the history on the housing crash in 2007 and whether or not we are in the midst of a housing bubble.
Inventory, Mortgage Rates, and New Construction
Matthew Gardner’s latest video on the housing market is full of important information regarding inventory, mortgage rates, future predictions, and new home builds. There continues to be an extremely limited amount of inventory, but Gardner is still expecting that the number of home sales will increase by more than 11% compared to last year. With such a significant upswing in home prices, over 30% of homeowners currently have more than 50% equity in there homes!
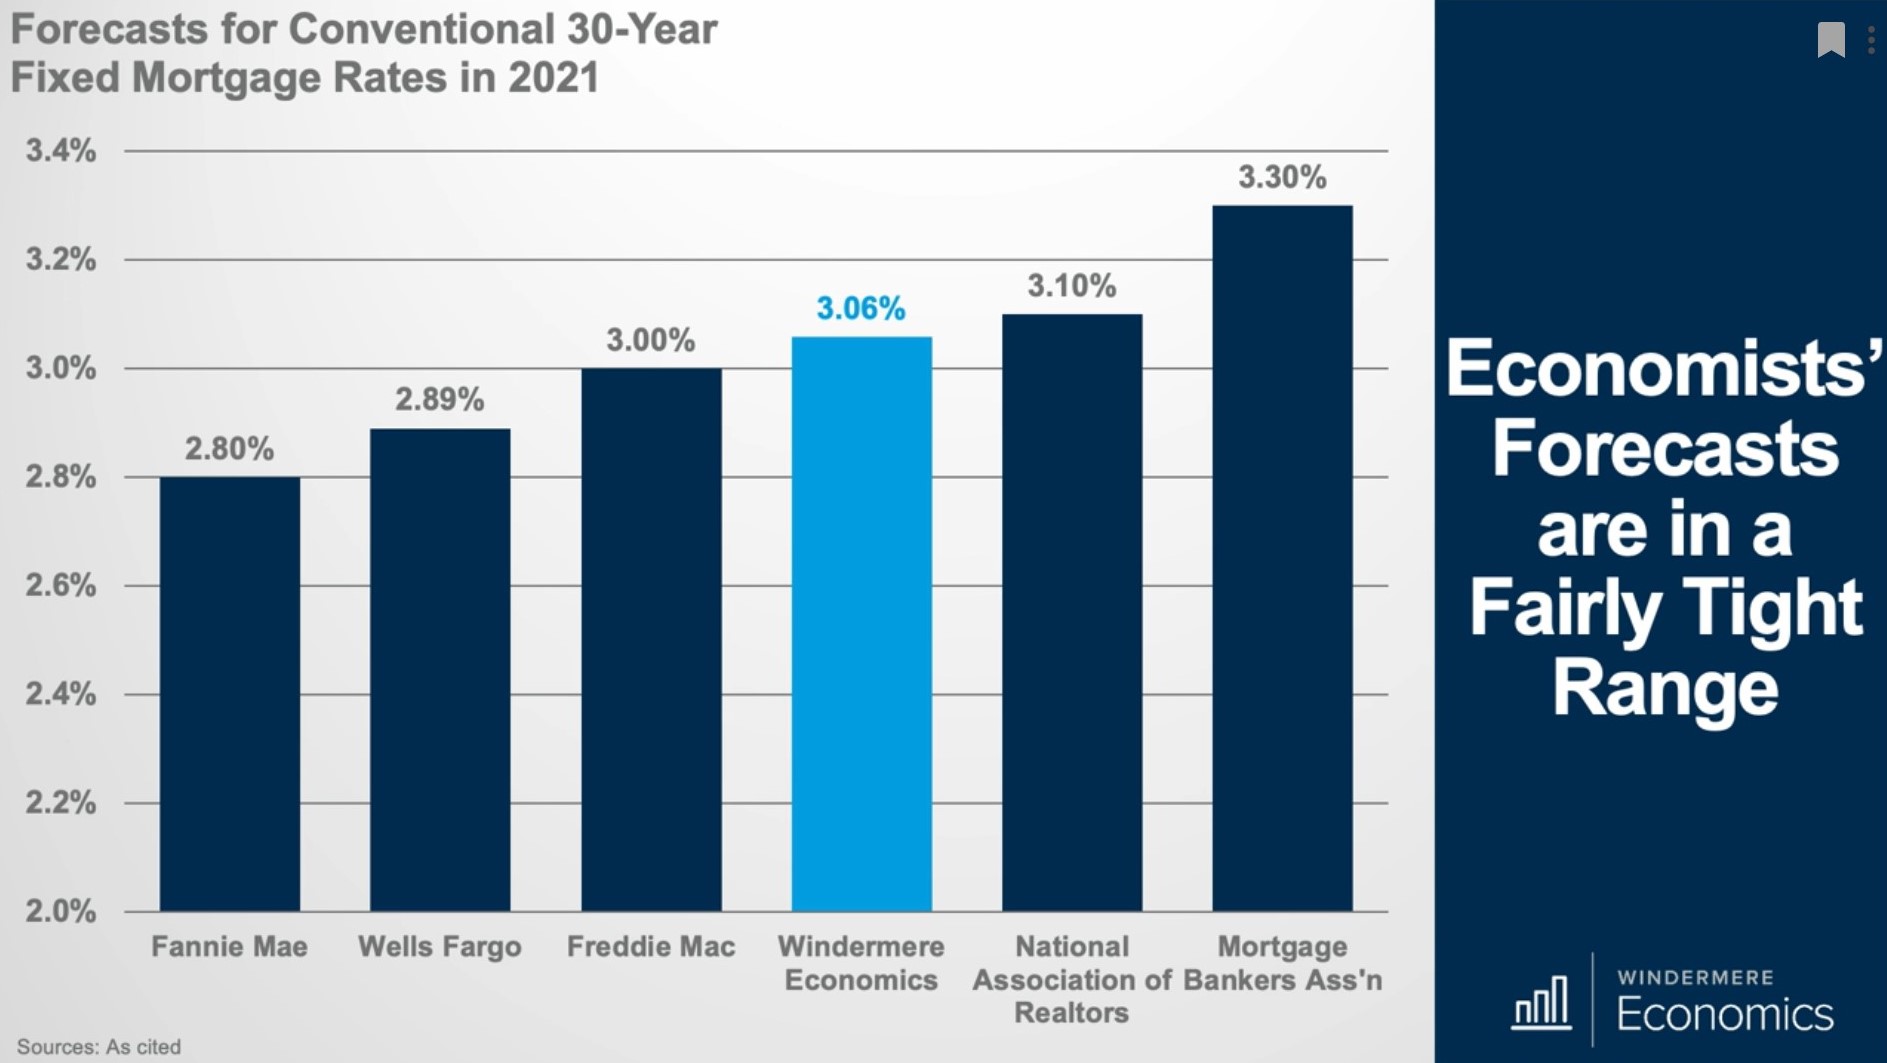
Diving into mortgage rates, it is clear that the rates began to jump in early February and it is pretty unlikely that they are going to go back down anytime soon. The spike is due to the widely distributed COVID-19 vaccine and as the country begins to open up more we will see a significant boost in economic activity. With so many receiving the vaccine, it is expected to see a boost in economic growth in the second half of the year and the potential for inflation to rise is now elevated, which has caused one thing- a move out of bonds. Specifically, 10 year treasuries, which means that interest rates for these bonds have to rise to attract more buyers and the interest rate on 10 year paper directly impacts mortgage rates.
Although, rates still remain remarkably low! The prediction for rates this year are expected to rise to an average of 3.6% by the fourth quarter of 2021. It won’t be until early 2022 that rates may creep back into the 4% range. Gardner mentions that inflation will level off after a short period of time and not get out of control. Although, if we do see an ongoing spike in inflation there is the potential for mortgage rates to rise faster than he is currently anticipating.


Moving on to new homes, home starts are down by 8.5% and single family permits are down by 10%. Builders are slowing down production due to lumber and material costs continuing to increase. Future construction is also at risk due to the limited amount of materials available, including appliances! Many projects have been put on pause due to cost, as lumber prices have increased by more than 180% since last spring. The price spike has caused the price of an average new single family home to increase by more than $24,000. On a positive note, the Futures price has been dropping and that may mean we are getting closer to the end of the massive increases in lumber prices.
Lastly, the National Association of Home Builders put out an analysis which suggests that the recent rise in mortgage rates over the past couple of months has priced over 1.3 million households out of the market for a median priced new home. Affordability is becoming even more of a major concern, as almost 58% of all households in the country cannot afford a median priced new home.
With all that being said, the bottom line is we need home price growth to slow and we need more inventory!


Home Ownership Rates
Matthew begins with information on the current home ownership rates and dives into the data regarding home buying and the younger generation. The ownership rate for millennials is increasing and the current rate of 38.5% is a share not seen since back in 2011. Gardner believes this number will continue to rise over the next several years. He also wouldn’t be surprised to see the younger generation shifting into home ownership in even faster rates due to the ability to work from home, allowing them to move out of expensive cities and move into more affordable markets where they can buy.
Younger buyers continue to account for a major share of total mortgage borrowing. In 2020, millennials and Gen Z borrowed over 1.3 trillion dollars to buy homes. That is over 35% of total new mortgage debt on a dollar basis!
Looking into ownership rate by ethnicity, the report below showed that the share of white households ticked up, but the ownership for black households, while it went up a little, is still well below where it should be. Gardner states that this is a long term, systemic issue that needs to be addressed. The ownership rate for black families in 2020, was 25% lower than for white families. Gardner is concerned and sincerely hopes overtime this discrepancy will be addressed.


Regarding the latest data on permits and starts, permits continue to grow significantly. Single family permits increased by 3.8% month over month and continue to come in 30% higher than we saw a year ago. There is a weakness in starts due to some very worried builders about increasing lumber and other construction material supply costs. Although, the number of homes under construction still continue to trend higher.
Looking into supply, the total inventory of homes is down 25.7% which is a new record low. Only 1.04 million homes are for sale, with only 1.9 months of supply. Even with this record low of inventory, the number of sales remain impressive.
Sales are up by 23.7% compared to a year ago, and there would have been even more sales if there was more inventory. Seventy one percent of homes are selling within the space of a month, and on average within 21 days.
The median sale price of homes is up 14.1% year over year. Homes for sale priced under $100,000 were down by 28% year over year and homes in the $500-750 range increased by 53% year over year. Sales of a million dollar plus homes were up 76.7% than a year ago and they accounted for 11% of all sales. Gardner says we should still expect to see home sales rise as more of the country opens up and the vaccine is more broadly distributed.


Housing & Economic Update
Matthew came out with his first video for 2021 and it’s full of great information! If you don’t have time to watch the full video we have provided some highlights below.
Starting with The National Association of Home Builders report we can see that the index has slipped from 86 to 83, but builder’s still see the market conditions as favorable opposed to poor since anything above 50 is positive.
It is not surprising that builder confidence has trended lower over the past two months, between surging COVID-19 infections and increasing material costs. Lumber prices are up by 52% compared to a year ago! Builders are dealing with a lack of affordable lots to build on, material supply, and labor shortages. This is creating an upward pressure on new home prices, which slows demand as prices increase.


Regarding permits and starts, activity has not slowed. The number of single-family permits issued rose by 7.8% between November and December with an annual rate of 1.226 million units which is 30.4% higher that what we saw a year ago and it is the fastest rate we’ve seen since 2007.
Housing starts are 27.8% higher and have increased now for 8 continuous months. Starts refer to a lot with a foundation that has been poured. The current level of ground up construction is at its highest level since 2007. These numbers should continue to rise and these new homes should take some upward price pressure off the resale housing market.


Looking at the resale housing market and inventory, we are currently at 1.9 months of supply of inventory which is the lowest number of homes for sale on record. We haven’t seen this level of low since 1982.
The total number of homes that sold in 2020 was the highest level we had seen since 2006. No one could have predicted how COVID-19 would effect buyers and the housing market.
Overall, low supply and strong demand continue to increase home prices. Mortgage rates have dropped a full percentage rate lower than they were a year ago and home sales have stayed strong, even on the higher priced end of the market, which is keeping housing prices high.
In 2020 sales of single family homes rose by 6.3% and only rose by .05% in 2019. Prices were on the rise increasing by 9.2% last year which we haven’t seen since 2013.
The 2021 Housing Forecast
This past year mortgage rates have broken record lows, and we have watched them drop week after week. Matthew Gardner predicts that rates will most likely bottom out in the current quarter but he doesn’t see mortgage rates increasing significantly next year.

Regarding existing home sales, Matthew Gardner forecasts that sales should be up by 6.9% in 2021, which is a level we haven’t seen since 2006. For sales to rise by this extent we need more inventory, and sales will most likely increase due to COVID-19, whether that is because homes are not set up for remote work or people do not need to live in their current location.
In 2020, sale prices were 7.4% higher than in 2019. Matthew’s 2020 forecast was 4% price growth rather than 7%, but COVID-19 changed all that. Mortgage rates dropped, people decided to moved for various reasons, and there was very limited inventory.
Gardner forecasts that prices will rise by 4.1% in 2021, but they will rise at a slower pace because there is a correlation between home prices and income. Mortgage rates dropping can only allow prices to rise so much and he also believes affordability issues will cause prices to rise at a more modest percent.


The number of active forbearances are down by 8% (roughly 246,000 homes) from just the end of October, and the number of homeowners in forbearance is down from almost 2 million from the peak we saw back in May.
While many believe the housing market is going to crash due to the amount of homeowners in forbearance leading homes to be foreclosed on and a large amount of inventory coming onto the market, creating home prices to drop, Gardner has a different theory.
He believes foreclosures will rise next year, but he does not think there will be an overflow of homes coming on the market and he predicts the number of foreclosures will be mild compared to what he saw in 2008-2010. Here’s why, looking back to March 2020, homeowners were in a very good place. Credit standards were tight, down payments were significant, and the economy as a whole was very healthy. Homeowners have built up equity, there is strong demand if people needed to sell, and lenders want to do a better job at keeping people in their home, by allowing missed payments to be added on little by little each month to their bill or allowing homeowners to extend their loan term.

The Latest US Home Sales Data
Existing home sales rose for the 5th consecutive month, and sales are 26.6% higher compared to a year ago.


As sales rose in October, so did prices. The median home price in October was up by 15.5% compared to a year ago, and we haven’t seen that pace of price growth since 2006. Mortgage rates being at an all time low are certainly affecting prices, but the low supply of inventory and high demand for homes is the largest factor contributing to this price growth.

There is an all time low for inventory available, and we are a long way from a balanced market.
A balanced market is somewhere between 4 to 6 months of inventory, and we are currently averaging around 2 months.
There was an average of almost 3 and a half offers on every transaction that was written last month. There were 7 out of 10 homes that sold within 4 weeks within coming online and the median market time was 21 days, a year ago it was 36 days.
Matthew reinforces his viewpoint that this pace in price growth is absolutely not sustainable. He also believes that while there are very favorable mortgage rates right now, he states that we are rather close to the lowest rates we are going to see in this cycle.
With this type of market Gardner states that something has to happen, and this pace in price growth has to slow down. He believes that we are either going to hit an affordability ceiling or we will see additional supply coming online this next year.
Housing Affordability Index
Quick Update from Matthew Gardner: How Will Election Results Impact the Housing Market?
Michael Hyman is the National Association of Realtor’s Research Data Specialist. Below is his most recent article from November 13, 2020, discussing the housing affordability index, median family income, and mortgage rates.
“At the national level, housing affordability declined in September 2020 compared to a year ago but rose compared to August, according to NAR’s Housing Affordability Index. Affordability increased in September compared to August as the median family income rose by 2.3% while the median home prices rose by 15.2%. The effective 30-year fixed mortgage rate fell to 2.95% this September from 3.00% in August. Mortgage rates are at all time lows compared to a year ago at 3.65%.

As of September 2020, the national and regional indices were all above 100, meaning that a family with the median income had more than the income required to afford a median-priced home. The income required to afford a mortgage, or the qualifying income, is the income needed so that mortgage payments make up no more than 25% of family income. The most affordable region was the Midwest, with an index value of 201.9 (median family income of $79,775 which is twice the qualifying income of $39,504). The least affordable region remained the West, where the index was 112.9 (median family income of $86,968 and the qualifying income of $77,040). For comparison, the index was 170.3 in the South (median family income of $74,859 and the qualifying income of $43,968) and 159.9 in the Northeast (median family income of $92,844 with a qualifying income of $58,080).

Housing affordability declined from a year ago in all regions. The South had a decline of 1.0% followed by the Midwest with a dip of 2.9%. The West had a drop of 1.0% followed by the Northeast with the biggest decrease in affordability at 6.3%.
Affordability is down in two of the four regions from last month. The South had a gain of 1.8% followed by the Midwest with an incline of 2.3%. The Northeast had a decline of 1.1% followed by the West with a dip of 2.3%.
Nationally, mortgage rates were down 70 basis points from one year ago (one percentage point equals 100 basis points). The median sales price for a single-family home sold in September in the US was $316,200 up 15.2% from a year ago, while median family incomes rose 2.3 % in 2020 from one year ago.

Even with lower mortgage rates compared to one year ago, the payment as a percentage of income rose to 15.7% this September from 15.2% from a year ago. Regionally, the West has the highest mortgage payment to income share at 22.1 % of income. The Northeast had the second highest share at 15.6% followed by the South with their share at 14.7%. The Midwest had the lowest mortgage payment as a percentage of income at 12.4%. Mortgage payments are not burdensome if they are no more than 25% of income.

This week the Mortgage Bankers Association reported mortgage applications decreased 0.5 from one week prior. Mortgage rates have continued to decline and are at a historic low. Demand for housing is still high with a lot of sellers sifting through multiple offers on their home. Low inventory levels remain an issue for first-time buyers and potential home owners.”


